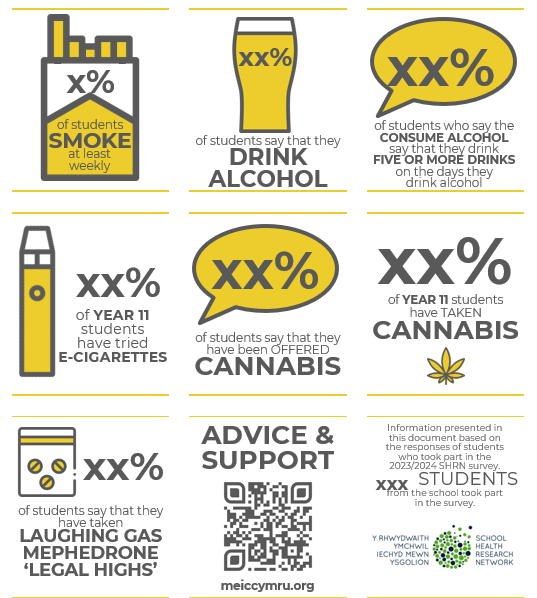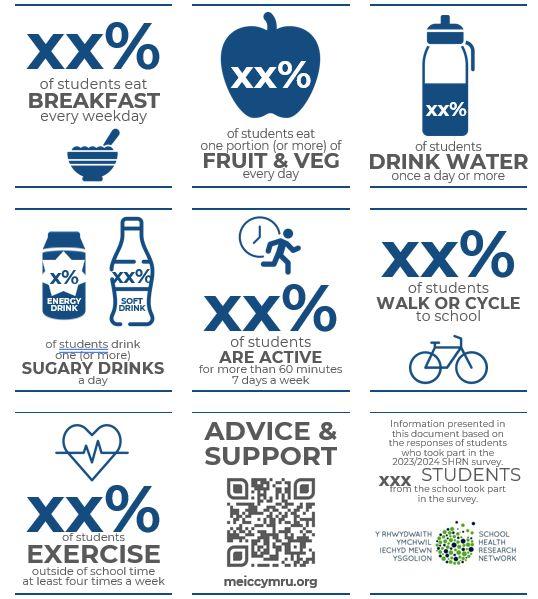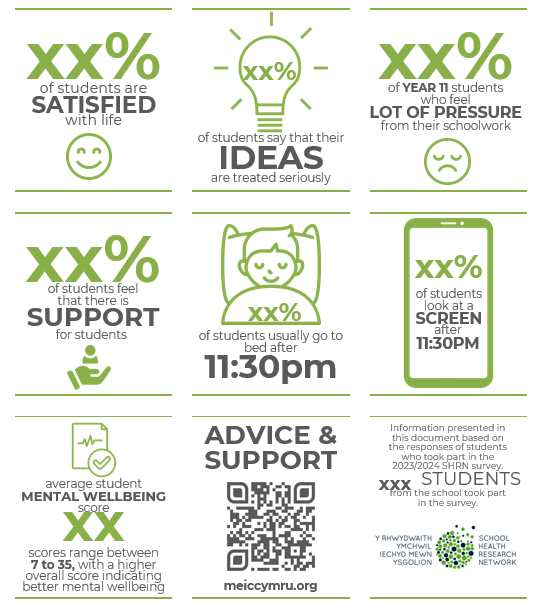
In this case study, Huw Eifion Evans, Healthy School Co-ordinator for Conwy, demonstrates how infographics can effectively communicate insights from SHRN data to a broader audience. By using these visual tools, key findings are shared with learners, staff, parents/carers, and school governors, fostering a deeper understanding of health and well-being across the school community.
An Introduction to Using SHRN Data Infographics
The Conwy Team has created infographics to help secondary schools present data from The SHRN Student Health and Well-being Survey in a way that is both accessible and engaging for everyone in the school community.
By using infographics and slide decks (a collection of slides used to support a presentation, such as MS PowerPoint), complex data is transformed into visually appealing and easy-to-understand formats. This makes it simpler for a wider range of stakeholders to grasp key insights and identify trends in learners’ health and well-being.
Using SHRN Data: Detailed Insights into Learners’ Health and Well-being
The SHRN Student Health and Well-being survey offers a comprehensive overview of learner health and well-being, covering topics which include physical activity, sleep, social media, and substance use. Schools find their individualised reports to be highly informative, providing rich, detailed data that offers valuable insights.
Read more about the benefits to schools here.
Schools greatly appreciate the breadth and depth of their SHRN data. While school health and well-being teams initially focus on understanding the full scope of findings, they also recognise the opportunity to highlight key messages and present the data in ways that maximise SHRN impact across schools.
Making Communication Easier with Infographics and Slide Decks
SHRN infographics, paired with a slide deck (e.g., MS PowerPoint), help schools effectively communicate key data in assemblies, meetings, lessons, and throughout the school environment. This ensures that important insights are shared clearly and engagingly, making it easier for everyone to understand and act on what they see.
The Benefits of Using Infographics
Since the introduction of infographics in Conwy Secondary Schools, engagement with SHRN data has increased significantly.
The infographics and slide deck make data more approachable, sparking curiosity and conversation among staff and learners. This engagement promotes a whole-school understanding of learner health and well-being.
Additionally, the infographics have encouraged schools to continue participating in The SHRN Student Health and Well-being Survey, recognising the data’s value for school-wide health and well-being insights.
How We Created the Infographics
Guided by good design principles focusing on clarity, simplicity, and functionality, we aimed for a clean and accessible style. We used high-contrast fonts and a mix of charts, icons, and graphs to make the data easy to understand and visually appealing for everyone.
We chose pie charts and icons because they present statistics clearly and engagingly. Feedback from health and well-being school leads helped us refine the design to ensure it was relevant and easy to use. We also included each school’s logo and branding to make the data feel familiar and foster a sense of ownership.
There are many free and easy-to-use design tools available for creating infographics, such as:
- Adobe Color: A tool for creating colour schemes.
- Canva: An easy-to-use graphic design platform.
- Flat Icon: A resource for free icons.
- Google Slides: A presentation tool that can be used for designing infographics.
(Please note – we wish to clarify that references to these products are not endorsements. Instead, we am sharing items that we have personally utilised and have proven to be effective. Our objective is to provide authentic insights based on our own experiences)
How Schools use Infographics
Conwy’s secondary schools have used the infographics creatively in a different ways:
- Informing the New Curriculum in Wales: Development and lesson plans.
- Embedding SHRN Data: Into the Whole-School Approach to Mental Health and Well-being framework.
- Supporting Learners’ Councils: Providing valuable data for discussions and initiatives.
- Displaying Around the School: In key areas such as staff rooms, noticeboards, and walkways.
- Presentations: For school governors and during learner assemblies.
- Sharing with Parents/Carers: Through social media and newsletters.


