Looking Ahead: A Shared Vision for the Next Chapter of SHRN
SHRN welcomes Dr. Kelly Morgan as its new Director. Kelly, in this blog, reflects on past successes and outlines plans to expand school partnerships, engage primary schools, and launch a school-level dashboard.

Reflections From The Director: Twelve Years of SHRN
In this blog, Professor Simon Murphy prepares to step down as Director of The School Health Research Network (SHRN) after 12 transformative years, he reflects on the journey of building a pioneering network that has become a global model. In Reflections From The Director: Twelve Years of SHRN, he shares his thoughts on SHRN’s legacy, the partnerships that defined its success, and his hopes for its future. Join us in celebrating his remarkable leadership and the next chapter for SHRN

Creative Connections: Using Arts-Based Methods to Engage Learners with SHRN Data on Emotional and Mental Well-being
Discover how SHRN is creatively engaging learners with data on emotional and mental well-being! In our latest blog post, SHRN team members – Max R. Ashton and Charlotte Wooders share their experiences from recent WNHWPS events in Cardiff and the Vale of Glamorgan. Learn how arts-based methods are being used to bring SHRN data to life, helping schools to better understand and support the well-being of their learners
Rising Schoolwork Pressure: A Two-Decade Trend Among Welsh Learners
In this blog, Dr. Jess Armitage from The Wolfson Centre for Young People’s Mental Health at Cardiff University explores how emotional problems among young people in Wales have surged in recent years. Despite this increase, studies investigating the reasons behind it are scarce and urgently needed. In a recent study using SHRN data, she examines trends in both emotional problems and perceived schoolwork pressure.
Exploring the Relationship Between School Transition, Mental Health and Bullying
Transitioning from primary to secondary school can be a significant milestone in a young person’s life. While many students navigate this change smoothly, others may find it challenging. A recent study using SHRN data delves into how socioeconomic status (SES) i.e. a family’s economic and social position, determined by factors like income, education, and occupation, might be associated with the transition experience, young people’s mental health and experiences of bullying.

The SHRN Student Health and Well-being Survey: A Comprehensive Look at Adolescent Health in Wales
In an era where young people’s mental health and physical well-being are frequently in the spotlight, the School Health Research Network (SHRN) stands at the forefront in providing schools and policymakers with robust, actionable data to support the implementation of evidence-informed solutions.
In This Blog, Dr. Nick Page, a Research Fellow at DECIPHer, and Senior Analyst for SHRN, gives an insight into the data we collect and how it’s helping to shape a healthier future for the next generation.

Building Brighter Futures: Supporting care-experienced young people in school and FE college transitions
For many care-experienced young people, school transitions are tough due to early trauma, mental health issues, and unstable support. Many struggle with social and emotional challenges , new routines, and financial worries. Leaving school often means leaving care and moving to independent living. Coordinated support from schools, colleges, social services, and mental health professionals is crucial.
In this blog, Dr. Sarah MacDonald, DECIPHer Research Fellow, delves into the findings of the WiSC study to understand how we can better support the well-being of care-experienced children and young people.

Infographics: Making SHRN Data Accessible and Engaging for Wider Audiences
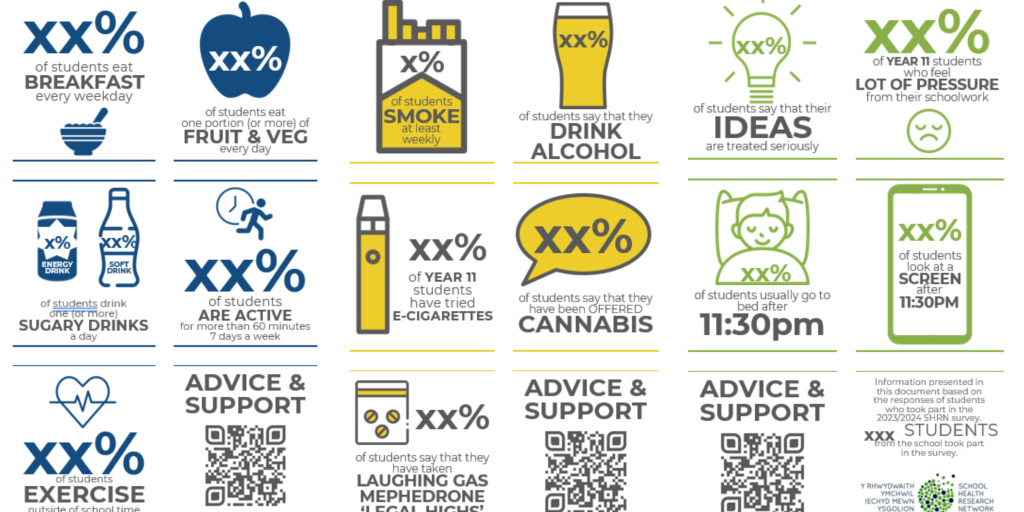
Infographics are a powerful tool for transforming complex data into engaging visuals that resonate with diverse audiences. In this blog, Huw Eifion Evans, Healthy School Co-ordinator for Conwy, shares his Top Ten Tips for using infographics to bring insights from The School Health Research Network (SHRN) data to life. Whether you’re aiming to communicate key findings with learners, staff, parents/carers or school governors, these tips can help ensure your SHRN data is both impactful and easy to understand.

Double the Insight, Double the Impact: The SHRN Student Health and Well-Being Survey and The SHRN School Environment Questionnaire (SEQ)
In this blog, Maria explores the significant benefits of the SHRN surveys for schools and how they can transform the educational environment for the better.

Removing barriers to exercise – period
A recent study found that girls and women are less likely to engage in regular physical activity than boys and men across Wales. But what role does menstruation play in this? Dr Kelly Morgan, Deputy Director of the School Health Research Network attended a recent workshop to find out more abouts tackling period poverty and understanding mensuration’s impact on girls’ physical activity.

Data Anonymity and The SHRN Student Health and Well-being Survey in Primary Schools
In this Article, Maria Boffey (SHRN Knowledge and Exchange Manager), explains the benefits of anonymised SHRN data, and how it can be used by schools, local authorities, Public Health Wales and Welsh Government to develop policies and practices to improve children’s and young people’s health and well-being.


